The report builder
Pick a source, a shape and the columns you want out.
Found in each project and your organisation. What's the difference?
Only host organisations use Reports, at both levels; guests never see it.
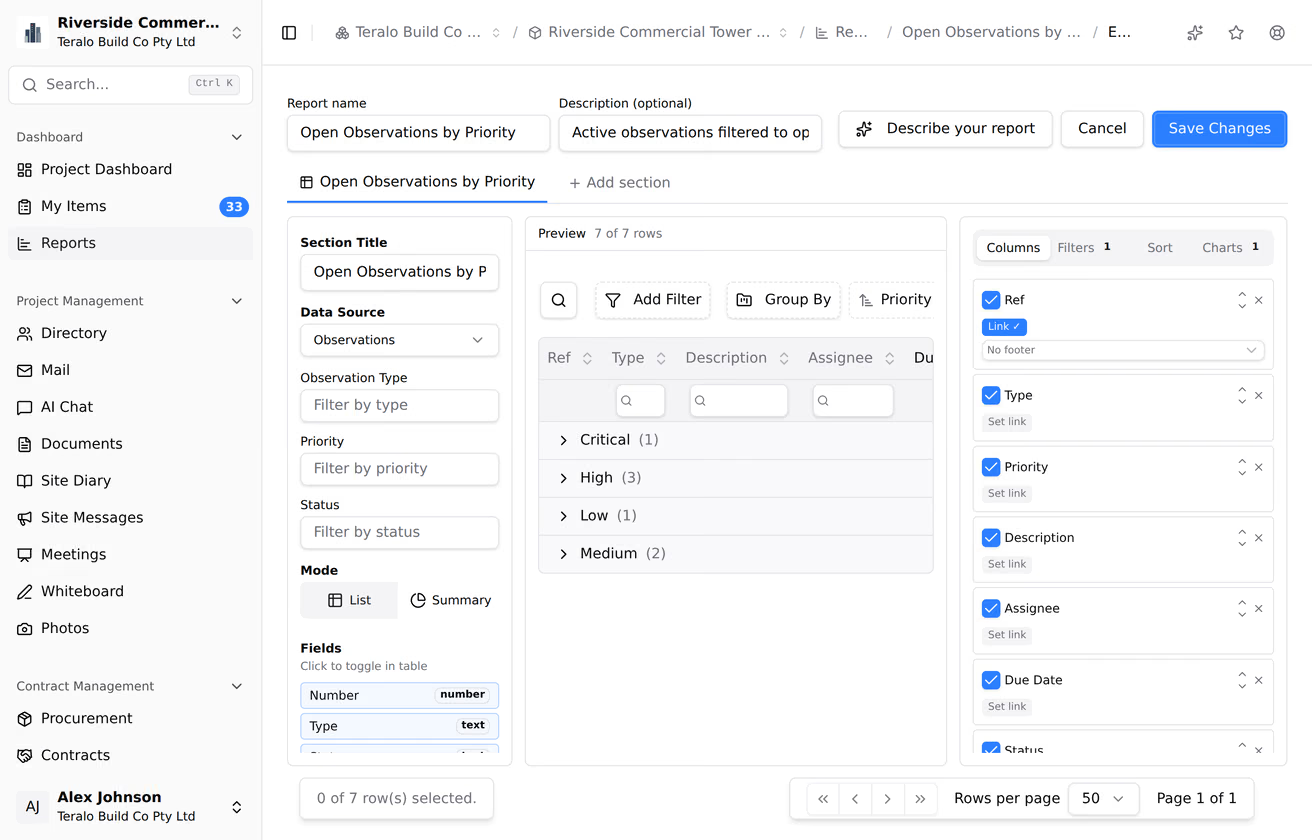
The report builder makes custom reports from the records in Teralo's tools. A report is one or more sections, and each section reads one data source as a list or as a summary, with its own filters and charts.
Reports is for host staff only. It is in the sidebar's Dashboard group, at project level and, on a host organisation, at organisation level. A guest organisation doesn't have it.
Select Reports to open the list. Each report shows its Name, the data sources it reads under Sources, who created it (Created By) and when it was last changed (Last Updated). A report with more than one section shows how many. A report shared with you carries a Shared badge.
To open a report in the viewer, select its row. To change it, open it and select the pencil (Edit).
The Dashboards tab beside Reports builds dashboards out of report charts. Learn more about dashboards.
- On the reports list, select New Report. On a project, then select Blank Report.
- Enter the Report name. Optionally, enter a description.
- Set up the first section, as below.
- Optionally, select + Add section for each further section.
- Select Create Report.

A new report starts with one list section reading Mail Items, with every field as a column. The builder needs a screen at least 1,024 pixels wide; on a narrower one it shows Larger screen required.
To save changes to an existing report, select Save Changes.
Each section has its own data source, filters and shape. The viewer shows a report's sections as tabs, and an export gives each its own worksheet or pages.
To delete a section, select the cross on its tab, then Delete. A report always keeps at least one section.
In the panel on the left:
- Enter the Section Title.
- Choose the Data Source.
- If the source asks for more, such as a Mail Type, choose it, or leave All.
Changing the source clears the section's columns, filters and calculated columns. The 20 data sources are:
- Mail Items: correspondence with its type, status, response and people.
- Contracts: contracts with their type, status, organisation and value.
- Progress Claims (Monthly): claims totalled by month, revenue against cost.
- Procurement: packages with their stage, category, budgets and tender dates.
- Inspections: inspections with their type, status, location and observation counts.
- Observations: observations with their type, status, priority, location and assignee.
- Incidents: incidents with their type, status, reporter, location and date.
- Submittals: submittals with their type, status, spec section and review.
- Permits: permits with their type, status, holder, location and expiry.
- Method Statements: SWMS with their activity type and submission status.
- Safety Data Sheets: chemicals with their manufacturer and hazards.
- Passive Fire Installations: installations with their required and achieved ratings.
- Site Diary: daily entries with their weather, hours, status and submitter.
- Equipment: plant with its category, type, service dates and induction.
- Bookings: bookings with their resources, status, dates and organisation.
- Inductions: workers and their registrations.
- Worker Licences: workers' licences and their expiry.
- Meetings: meetings with their type, status and attendees.
- Program Activities: program tasks with their dates, progress and status.
- Organisation Compliance Documents: requirements and what's been submitted against them.
Each source needs the view permission of the tool it reads, checked for the person viewing the report, not its author. A few need a different one:
- Procurement and Progress Claims (Monthly) need Can view contracts.
- Passive Fire Installations needs Can manage passive fire installations and tool settings.
- Organisation Compliance Documents needs Can view reports and dashboards.
- Inductions and Worker Licences need Can view the inductions register and worker profiles.
On a project report, a section you can't see shows a note saying you don't have permission to view that source's data. On an organisation report, it shows no rows.
With Mode set to List, a section is a table of rows. In the panel on the right:
- Columns: turn each column on or off, and reorder them with the arrows. Under Fields on the left, select a field to add or remove it.
- Filters: narrow the rows. Learn more under Filters, below.
- Sort: choose the Default Sort and Default Grouping.
- Charts: add charts drawn from the rows.
For a number or currency column, choose a footer: Count, Sum, Average, Min or Max.
In a list section, one column links each row to the record it came from. A new section links its first column. To link another, select Set link on that column.
Most sources link to the record itself. Progress Claims (Monthly) links to the contracts register, Organisation Compliance Documents to the organisation in the directory, Program Activities to the program, and Worker Licences to the worker. On an organisation report, the link opens the row's project.
With Mode set to Summary, a section is a pivot table: groups down the left, categories across the top and a number in each cell. Switching mode keeps the section's filters and calculated columns.
- Under Fields on the left, select Row beside each field to group by. Several row groups nest, outer to inner.
- Optionally, select Col beside a field to spread across the top, such as a month.
- Select Val beside each field to total. On the Values tab, choose each value's aggregation: Count, Count Distinct, Sum, Average, Min or Max. Optionally, give it a label and a format.
- On the Layout tab, under Totals, choose Row totals and Column totals. Both are on to begin with.
Count counts rows, whichever field it is on.
- On the Filters tab, select + Add.
- Choose the field, the operator and the value.
The operators are Equals, Not equals, Contains, Does not contain, Greater than, Greater or equal, Less than, Less or equal, Is one of, Is not one of, Is empty, Is not empty and Date range. Contains and Does not contain work on text, the greater and less operators on numbers, amounts and dates, and Date range on dates.
Is one of and Is not one of take a comma-separated list. A filter matches the value as Teralo stores it, such as in_progress, not the label the table shows.
Date range takes two fixed dates. There's no rolling option such as this month in the builder, so a date range stays the same each time a scheduled report is sent. Learn more about exporting and scheduling reports.
To add a chart to a list section:
- On the Charts tab, select + Add.
- Enter the chart title.
- Choose the Type: Bar, Stacked Bar, Horizontal Bar, Line, Pie or Donut.
- Choose the Aggregation, the Category field and, unless the aggregation is Count, a number or currency Value field.
A list section can have any number of charts. A summary section has at most one: on its Chart tab, turn on Show chart, then choose the Type and the Measure from the pivot.
A summary section's chart can be a Gauge, which draws the first number in the pivot on an arc. It takes a Min, a Max, Warn At, Danger At and a Target.
By default, the arc is red below Warn At, amber from Warn At and green from Danger At. With Lower values are better ticked, it is green below Warn At, amber from Warn At and red from Danger At. The viewer shows a gauge in place of the pivot table.
A calculated column is arithmetic on other columns: add, subtract, multiply, divide, a percentage, or the days between two dates. Days Until Service on the Equipment Service Due template is one, and Net Position on Cash Position is another.
The builder has no control to write, edit or remove a calculated column. A section gets one from a template or from Describe your report. Calculated columns sit at the end of the table, and can't be used as a summary value.
- In the builder, select Describe your report.
- Describe the section you want, such as "a summary of open observations grouped by priority".
- Select Generate.
Teralo adds one section, choosing its data source, columns or values, filters and any calculated column. Everything it builds can be edited. It doesn't set a source's own options, such as the mail type. Each description spends AI credits.
The centre of the builder is a live preview of the section, showing up to 200 rows, with a count of how many rows there are in all.
- On a project's reports list, select New Report, then From Template.
- Choose a template.
- Change anything you need, and select Create Report.
The templates are:
- Extension of Time Register: extensions of time from mail items. Set the mail type after creating it.
- Cash Position: monthly revenue against cost from progress claims.
- Open Inspections Summary: active inspections with issue counts by type.
- Overdue Observations: open observations with a due date, and days overdue.
- Submittal Tracker: submittals by status with review duration.
- Permit Expiry Tracker: active permits with days until expiry.
- Incident Summary: all incidents with type and status.
- Equipment Service Due: equipment with a next service date.
- Site Diary Weekly Summary: this week's daily entries with weather and hours.
- Booking Utilisation: bookings by organisation.
Each template is a list section that can be edited like any other. An organisation report has no templates.
At organisation level, a section reads every project the organisation hosts where you hold the source's permission. The viewer adds a Project column to list sections, and their exports.
Two people opening the same organisation report each see the projects they can see, so their totals can differ.
- Open a project report and select the up-right arrow (Promote to Org).
- Select Promote.
Teralo copies the report's name, description and sections to a new organisation report, which reads across every hosted project. The project report doesn't change, and the two are separate from then on. Shares and schedules aren't copied. Promoting needs Can create, edit, and share reports and dashboards at project and organisation level.
Open the report and select the two squares (Duplicate). Teralo makes a copy at the same level, named with "(copy)" at the end, and opens it in the builder.
Warning: Deleting a report is permanent, and deletes its shares and schedules.
- On the reports list, open the report's three-dot menu and select Delete.
- Select Delete again to confirm.
| Permission | Allows |
|---|---|
| Can view reports and dashboards | Opening Reports and any report in it, exporting, and sending a snapshot |
| Can create, edit, and share reports and dashboards | Creating, editing, duplicating, promoting, sharing and scheduling reports, and describing a section |
| Can delete reports | Deleting a report |
These permissions exist at project and organisation level, and only host staff can hold them. Manage includes view. Delete is separate. If your plan withholds Reports & Dashboards, nobody holds them. Learn more about how permissions work.